
Monetary Poverty Policy
- Martin Enlund
- 6/21/22
Why is inflation so high, and what does the powers that be plan to do about it? Let’s start our attempt at answering this by looking at the supply side, where we have seen massive amounts of negative shocks to the supply side in recent years. In particular since the discovery of the COVID-19 virus.
In 2020, virus fears and lockdowns changed consumption patterns, boosting demand for goods while limiting demand for services. You simply can’t consume as many services if you stay indoors, whether voluntarily or not. This change in the composition of demand was inflationary for several reasons: it made goods scarce (few if any producers were prepared for such a huge pick-up in demand), goods prices are more variable, and goods production is more energy intensive than services production.
Figure 1. Composition of demand changed

The response to the pandemic also impacted labour supply negatively, in inflationary ways. Travel bans limited global mobility and hence global labour supply. Less immigration entails a better wage-bargaining position for local labourers, which has been good news for wage growth (and inflation). What’s more, Biden’s bonus benefits reportedly made some people better well-off economicially by sitting at home than looking for jobs. School and day care closures also led to a surge in home schooling and such, limiting labour supply further.
Vaccine mandates and movement licences vaccine passports also limited labour market mobility and boosted structural unemployment (greater frictional unemployment in econo-speak). Rampant money-printing and ultra-low policy rates and yields boosted asset prices, which in turn led to a rise in early retirement which limited labour supply. Alcohol and drug abuse has also increased, also impacting labour supply negatively.
Figure 2. Labour market mismatches led to a shift of the Beveridge curve

The inflationary labour market angle is evident by the outward shift of the Beveridge curve (the relationship between job openings and the unemployment rate). Had the relationship between the two variables stayed the same as during the 2010 to March 2020 period, the current rate of job openings would have implied a negative unemployment rate(!). This outward shift is suggestive of a substantial rise in the natural rate of unemployment rate (the unemployment rate needed to keep inflation stable).
Figure 3. An incomplete list of negative supply shocks
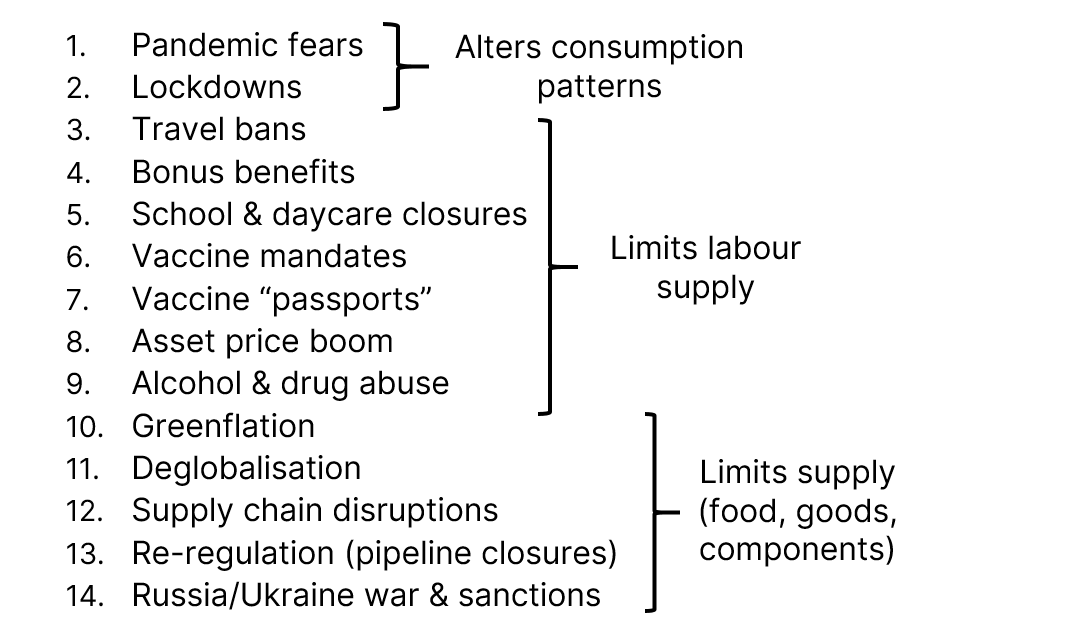
The powers that be have indeed been messing around with the supply side, and the list above is far from an all-encompassing one. So, what have they done to the demand side? Well, the answer is simple. They have been throwing around money willy-nilly.
Meme 1. Money supply growth - the elephant in the room
Indeed, the pace of broad money creation in the US has been record-shattering. In comparison to previous QE programmes the Fed’s money printing recently occured in tandem with fiscal stimulus, basically “going direct” as suggested at the Jackson Hole conference in August 2019. Indeed, according to some estimates the fiscal spend “on COVID” was greater in dollars than the inflation-adjusted costs of World War II, the 2008 financial crisis and the 2009 great recession stimulus. Combined.
Figure 4. Money growth vs core CPI inflation

Figure 5. A more complete list of inflationary factors

So what’s next? Let’s now look the typical relationship between prices and stuff consumed in micro economics. The cheaper the price, the more stuff will be consumed (a downward-sloping Demand curve). But the cheaper the price, the fewer items will be produced (an upward-sloping Supply curve). Before the pandemic, we found ourselves at (1). Lots of stuff were being consumed at at fairly benign price level.
Figure 6. Prices & quantities during a negative supply shock

As a result of the wrecking of the supply side, the Supply curve shifted to the left (S’). This has caused an inflationary shift from (1) to (2).
Figure 7. … and then during a demand shock
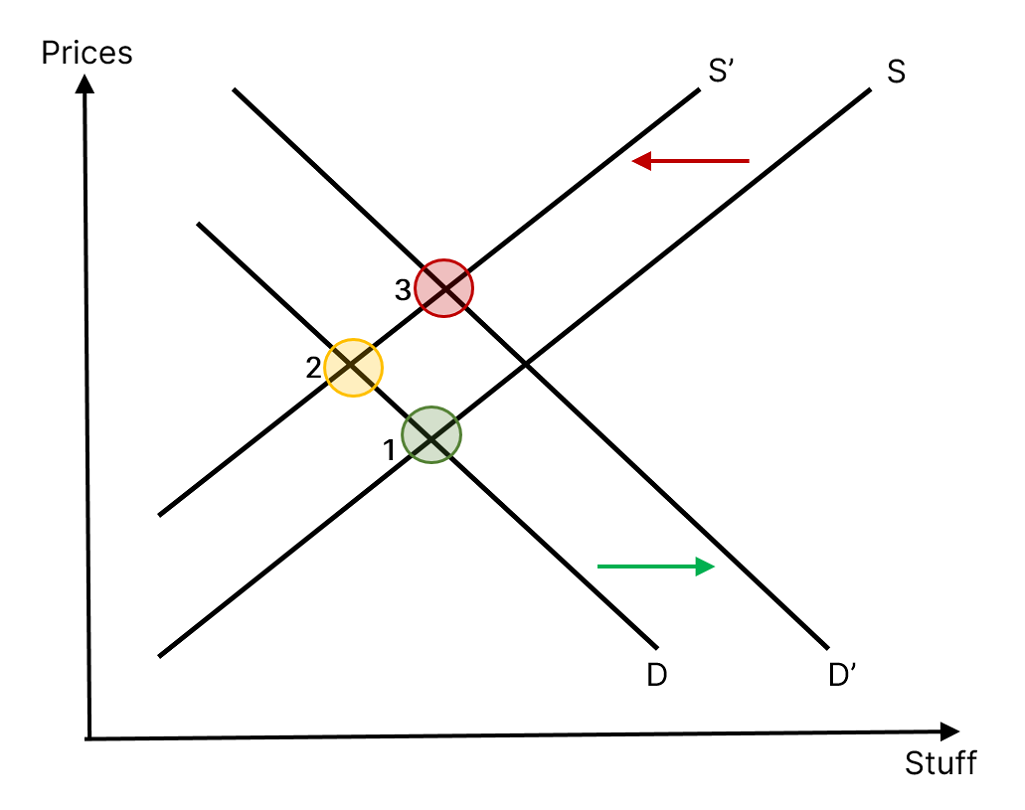
But at roughly the same time the authorities and the banking system, which is the chief engine for money creation, have been creating the most dollars in modern history as well as getting it directly into people’s hands (“going direct”). This led to a shift of D to D’, and from (2) to (3). Much inflation now. Big surprise.
So how can this situation be solved? The powers that be could try solving supply side issues (restarting nuclear reactors, incentivize energy and food production, implement measures to boost flexibility on labour markets, end or relax sanctions, and so on). But since they for some reason seem dead set against doing just that, demand needs to be “solved” instead.
What does solving demand mean? In the words of ex-Fed William Dudley (who once argued the Fed should try to stop a sitting President from getting re-elected):
(…) many U.S. households do hold a significant amount of their wealth in equities. As a result, they’re sensitive to financial conditions: Equity prices influence how wealthy they feel, and how willing they are to spend rather than save.
Figure 8. Monetary Poverty Policy

In short, barring successful attempts to solve supply chain issues, the Fed needs to crash household wealth (housing, equity, crypto) so that the demand curve can be shifted to the left (D’’), a shift from (3) to (4).
“Real disposable income per capita is on track to show the greatest yearly decline since 1932”, CNN reported recently.
Maybe you won’t own nothing, but you will own less. Will you be happy?
If you wish to subscribe, sign up here!